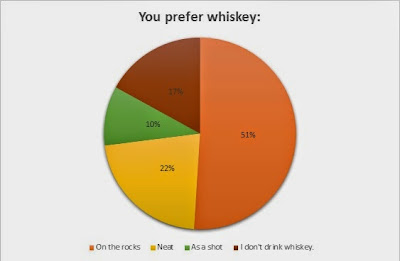
I chose three questions from the survey. Then, I copied and pasted the questions into Excel; I had to "massage" the information, so that the program would properly take the information and format it into a different graphs. Because I'm using a PC, I had to press PrtScn to capture the images of the graphs. After, I opened up Paint, a program on PC's, to paste my image. Lastly, I had to crop the images and save them individually on my desktop. After that, adding the graphs into a blog post was easy; I simply uploaded the images.


No comments:
Post a Comment